
Team dashboard
The team dashboard is a place to view the ongoing activity of the team and related insights. It has the following three areas:
1. Left panel
2. Middle panel
3. Right panel
Left panel
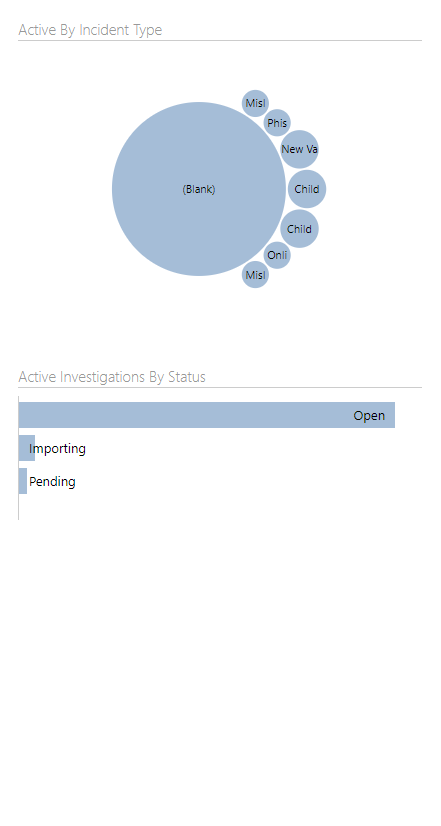
The left panel is divided into two areas, each of which displays an interactive infographic about active investigations. These are Active By Incident Type and Active Investigations By Status.
-
Active By Incident Type: This shows a visual representation of active investigations by their incident type, such as misleading words or digital images on the internet, child sex tourism, etc.
-
Active Investigations By Status: This shows a visual of the active investigations by their status, such as open, importing, pending etc.
To navigate the left panel of team dashboard, follow the steps given below:
- Hover over various parts of the visualization to see useful insights as tooltips.
- Click on any part of visualisation to filter the list of team investigations present in the right panel.
- Click at the same place again or the filter icon on the top right of left panel to remove the filter on the list of investigations.
Middle panel
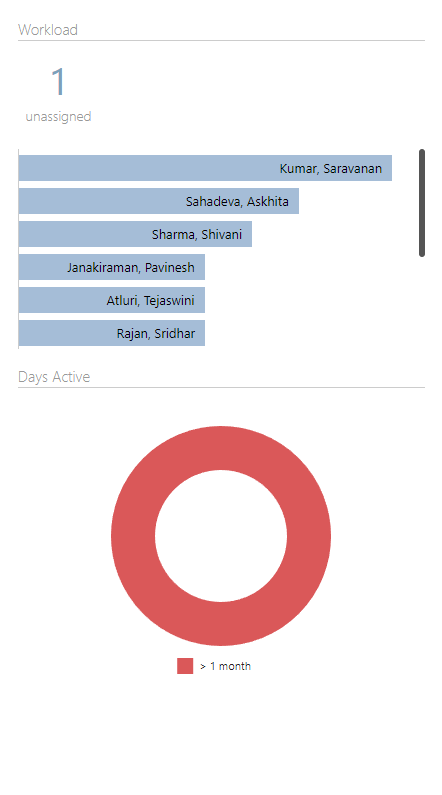
The middle panel is divided into two areas, viz. workload and days active.
-
Workload: It shows the total number of unassigned investigations and the workload for each individual in an ascending order. It has a scrollbar that allows viewing the workload for each individual member. If there are a lot of members in the team, a More button will be shown at the bottom, clicking on which will expand the team.
-
Days active: It is a multi-colour donut representation of the number of days the team members were active for. A legend is present below the donut representation that indicates the time period each colour in the visual denotes.
To navigate the middle panel of team dashboard, follow the steps given below:
- Hover over various parts of the visualization to see useful insights as tooltips.
- Click on any part of visualisation to filter the list of team investigations present in the right panel.
- Click on it again or the filter icon on the top right of left panel to remove the filter on the list of investigations.
Right panel
The right panel contains the following:
- The total number of active team investigations
- The total number of active investigations with the status high priority
- A list of investigations with the their status and date of last edit.
- An edit icon to edit an investigation
- A plus icon to add a new investigation
- A share icon to share the investigation
To navigate the middle panel of team dashboard, follow the steps given below:
- To filter the list of investigations, click on either the total number of active investigations or the total number of active high priority investigations. This results in a colour-coded filtered list, now containing only the active investigations or active high priority investigations.
- Click on it again or the freshly appeared filter icon on the top right of right panel to remove the filter.
- Click on any investigation to view more details related to that particular investigation.